Bitnome | Example report
Inspect an example output
Review sample quality, alignment metrics, and analysis summaries in one report.
Aligned reads by sample
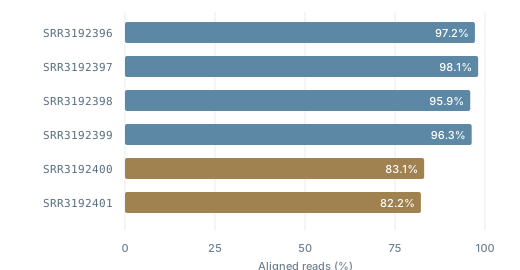
Alignment rates across six samples. Amber highlights the two lowest values shown.
Selected sample metrics
| Sample | Aligned | Unique |
|---|---|---|
| SRR3192396 | 97.2% | 93.7% |
| SRR3192397 | 98.1% | 94.7% |
| SRR3192398 | 95.9% | 88.2% |
| SRR3192399 | 96.3% | 88.2% |
| SRR3192400 | 83.1% | 77.3% |
| SRR3192401 | 82.2% | 76.4% |
Alignment metrics (%) · Values rounded to one decimal place. Unique = uniquely aligned reads.
Source and interpretation
The original report is hosted by Seqera and lists MultiQC version 1.35. This preview reproduces six selected sample rows from General Statistics, with aligned and uniquely aligned read percentages. The chart and table use the same values.
The publisher describes an RNA-seq workflow accidentally applied to ChIP-seq data. This example illustrates QC report presentation; analytical suitability requires an assay-specific workflow.
Explore full report ↗ · Publisher context ↗
Reading the metrics
Alignment metrics support sample-level review alongside other QC measures and study metadata.
Attribution
MultiQC: Ewels et al. (2016), Bioinformatics. doi:10.1093/bioinformatics/btw354. Source accessed 13 October 2026. Values reproduced to one decimal place.